

Forecasters Who Think Again Are More Accurate
Forecasters Who Think Again Are More Accurate
Technical White Paper, February 2022, by Christopher W. Karvetski

1. Introduction
Good Judgment Inc was pleased to collaborate on a forecasting challenge with Wharton Professor Adam Grant on the occasion of the publication of his new book Think Again: The Power of Knowing What You Don’t Know[1]. The challenge[2] kicked off in February 2021 and concluded in September 2021. By tracking and analyzing forecasting activity on our public forecasting platform Good Judgment Open (“GJ Open”; gjopen.com), we aimed to measure the extent to which better forecasters reap the benefits of “thinking again” and updating their predictions, and the extent to which individual differences are associated with more accurate forecasting.
The challenge included 25 forecasting questions, which spanned topics related to economics and politics, COVID-19, the commercial space race, the Olympics, and other current events. Each forecasting question was open an average of 122 days. In total, there were 20,517 forecasts from 2,274 forecasters on GJ Open during the challenge. Each forecaster received a question-level Brier score—a widely used system to track forecast accuracy[3]—for every question on which the forecaster provided at least one forecast as follows: if a forecaster provided a forecast midway through a question, he or she received the average daily Brier score of other forecasters on the days preceding his or her first forecast, and then the score for his or her forecast was carried over into subsequent days until either the question resolved or the forecaster updated his or her forecast. Given the question-level score was the average over all days the question was open, it was in the best interest of a forecaster to update as new information became available to minimize his or her score.
To track relative performance, a challenge leaderboard displayed the sum of each forecaster’s accuracy score – the forecaster’s question-level Brier score minus the question’s average score – such that negative scores implied better forecasters. Forecasters had to do well on multiple questions in order to place highly on the leaderboard. A Think Again survey was initiated prior to the start of the challenge and during the challenge the registered forecasters received weekly tips that merged lessons from Think Again with best forecasting practices, such as frequent updating, optimal information search, and other tips.
2. Findings
We looked at the relationship between updating and accuracy in multiple ways. Our first analysis was to look at how frequency in updating was linked to better accuracy within the challenge. For each question, we sorted forecasters into five buckets corresponding to the number of forecasts (and updates) they made on the question. The first bucket corresponded to all forecasters who made only a single forecast on the question, the second bucket contained all forecasters who made an original forecast and one update, and so on. Finally, the fifth bucket included forecasters who made an original forecast and at least four updates on a question. We then calculated the average question-level Brier score for each bucket and averaged these scores over all 25 questions. The results are shown in Figure 1, with the overall question-level Brier score of 0.40 shown as the dashed line.
When forecasters made only a single forecast on a given question, the average question-level Brier score was 0.46. However, forecasters who made two forecasts on a question (initial forecast plus one update) saw a 28% improvement (score of 0.33). We see diminishing, but continuous, returns after two forecasts. Overall, there is clear evidence that taking a second look at a question is a good way to significantly improve forecasting accuracy.
One critique might note that if two forecasters both made forecasts on day 1 of a question, and the first forecaster never updated (thus his or her original forecast was carried through until the end) while the second forecaster updated midway through when more information was available, then clearly the second forecaster would have an accuracy advantage. To address this concern, we denoted all forecasts as either a first forecast on a question or an update forecast (whether the second forecast or the 17th forecast for a question, all update forecasts were denoted the same way). We then paired all forecasts that were made on the same question and the same day and selected days with at least one first forecast and one update forecast.
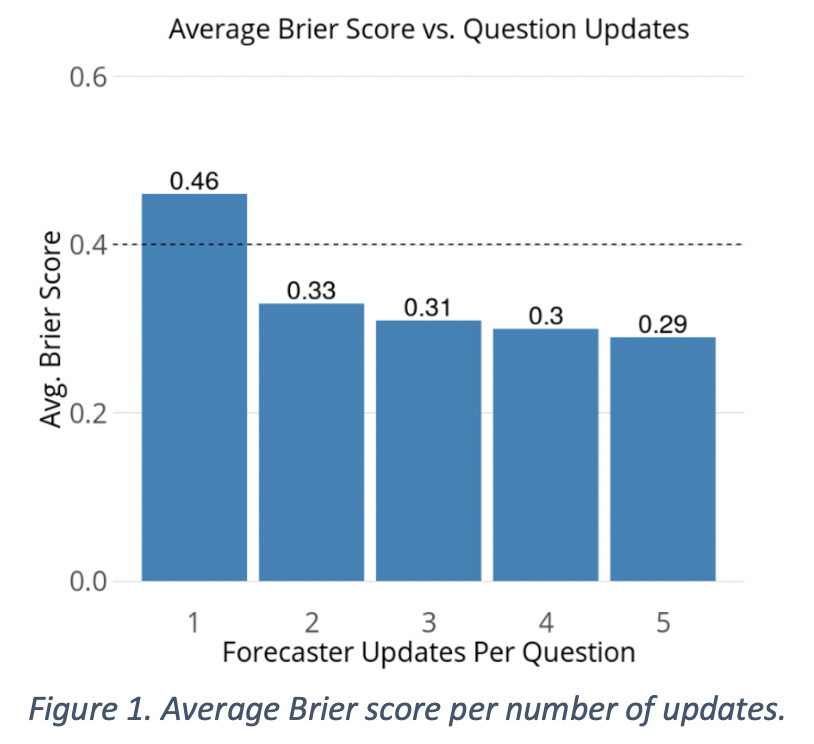
Figure 1. Average Brier score per number of updates.
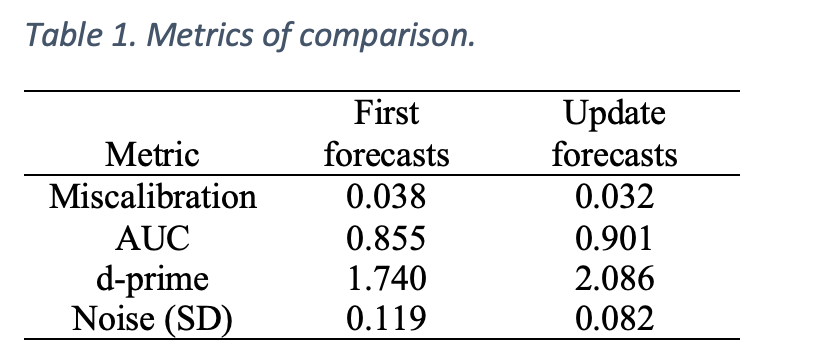
In total, there were 1,691 such days with a total of 15,176 forecasts. We calculated an average daily Brier score across all forecasts within each of the two groups (first vs. updates) to generate 1,691 pairs of scores. We then averaged the scores within each group across all 1,691 days. We found the average score for first forecasts was 0.362, versus an average of 0.278 for update forecasts. Thus, even when holding information and timing constant, update forecasts were 23% more accurate than first forecasts. Table 1 shows forecasting metrics of (mis)calibration, discrimination, and between-forecaster noise (defined here as the average bin standard deviation of two or more forecasts made on the same day by different forecasters) for the two groups of forecasts. Update forecasts are better calibrated (16% improvement), have better discrimination, and reduce noise (31% improvement) versus first forecasts (note that noise was calculated on a subsample of 868 days with at least two first and two follow-up forecasts). Thinking again and updating a forecast appeared to play a large role in forecast accuracy by allowing forecasters to better understand the task at hand and possibly better balance the competing perspectives among the various possible question outcomes.
Table 1. Metrics of comparison.
A second critique might note that the forecasters making updates are simply more experienced and better forecasters, whereas the one-and-done type forecasters are less experienced. To control for this, we focused on new forecasters who signed up on GJ Open on or after February 1, 2021 (roughly the start of the challenge; N = 1,020 out of the original 2,274 forecasters). Repeating the same analysis by pairing first versus update forecasts to the same day, we had 471 days with at least one first and one update forecast, and when taking the average daily Brier score and aggregating over all days, we found the first forecasts produced an average score of 0.367, versus 0.220 for update forecasts, a 40% improvement. In this forecasting challenge, the effect of updating was especially pronounced among the less experienced forecasters.
To control for variation across different forecasters due to forecasting experience, expertise, etc., we conducted a within-forecaster comparison. We selected the 1,921 instances where a forecaster made a forecast on a question and then updated the forecast within 30 days. The results are shown in Figure 2, where the x-axis represents the number of days between the first and second forecast, and the y-axis represents the average Brier score differential, with a negative score implying the update forecast was more accurate. Surprisingly, we saw that when the update was made on the same day as the original forecast (Days between = 0), the largest gain in accuracy resulted. Looking through the comments of these same-day adjustments points to three (non-exhaustive) reasons for updating: (i) the forecaster made an error in the original forecast, and possibly did not fully understand the forecasting question or did not correctly use the forecasting interface, (ii) after logging his or her forecast, the forecaster then reviewed the forecasts and opinions of others and was swayed to update, or (iii) the forecaster was motivated to do additional research on their own and revised his or her estimate accordingly. We see that after same-day updates, the Brier score differential begins to increase but is still negative. After about 10 days in between forecasts, the differential begins to decrease, which we would expect since new information is becoming available over time.

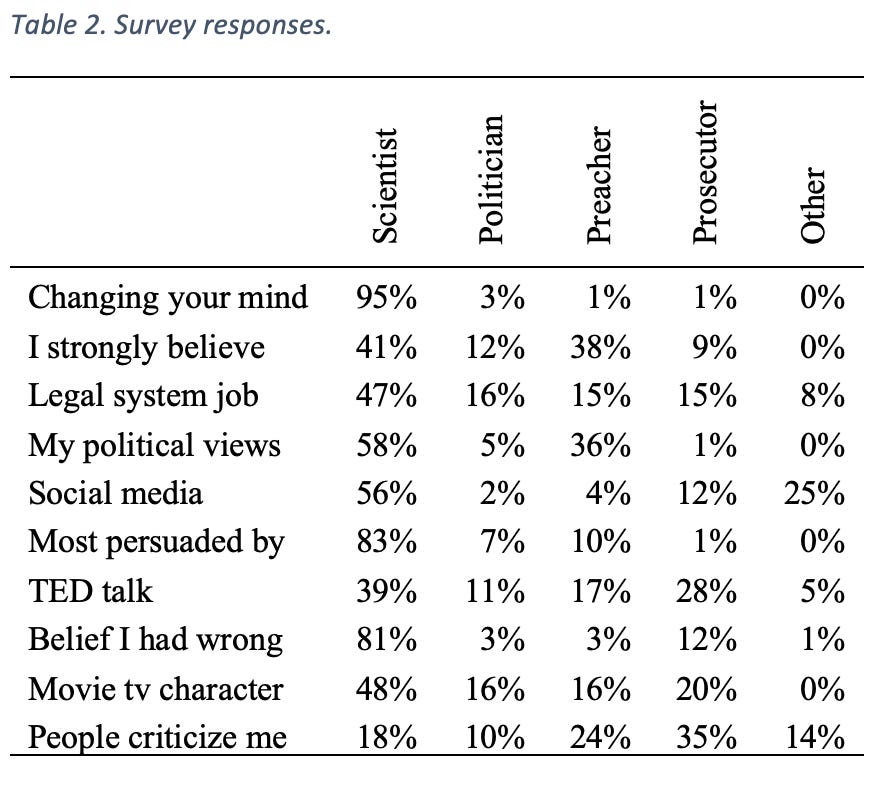
The Think Again survey that accompanied the 25 forecasting questions contained ten multiple choice questions, with each question having a response that was linked to a different mindset or mode that individuals can slip into at various times or for various reasons[1]. We engage in “Preacher” mode when our sacred beliefs are challenged and we deliver sermons to protect these beliefs; we engage in “Prosecutor” mode when we try to point out potential flaws in others’ reasoning; we engage in “Politician” mode when we seek to win approval for our beliefs from others; and we engage in “Scientist” mode when we recognize the limits of our knowledge and constantly test and re-test our ideas and update our views based on new data. In total, there were 584 participants who completed the ten survey questions with responses linked to the different mindsets who made at least one forecast on the 25 forecasting questions. The percentage of responses per question per mindset are shown in Table 2. The “Scientist” response was the modal response in nine of the ten questions. To characterize each survey respondent, we averaged the number of responses within each of the five categories to get an associated vector that represented the five categories. On average, each respondent was 56% “Scientist”, 9% “Politician”, 16% “Preacher”, 13% “Prosecutor”, and 5% “Other”.
We found that an increase in forecasters’ responses linked to the “Scientist” mindset was associated with better accuracy scores (r(584) = -.08, p = .057), and more updates per question (r(584) = .10, p = .017) whereas the greater the percentage of “Preacher” responses was associated with worse accuracy scores (r(584) = .12, p = .003) and fewer updates per question (r(584) = -.15, p < .001). The percentage of “Prosecutor” responses was not associated with better accuracy or more updates (p’s > .2), whereas the percentage of “Politician” responses was associated with fewer updates per question (r(584) = -.08, p = .059), but was not significantly associated with accuracy scores (p = .27). While the statistically significant effects are small, they are aligned in that the “Scientist” mindset, as opposed to “Preacher” mindset, is associated with more accurate forecasters that are more inclined to update their beliefs.
Table 2. Survey responses.
Notes
[1] Grant, A. (2021). Think Again: The Power of Knowing What You Don’t Know. New York, NY: Viking.
[2] The forecasting challenge can be accessed here: https://www.gjopen.com/challenges/53-think-again-with-adam-grant
[3] A Brier score is equivalent to a squared error score. For example, if we predict it will rain tomorrow with 80% probability, our score if it rains is (1-0.8)2 + (0-0.2)2 = 0.08. If it does not rain, our score is much worse: (0-0.8)2 + (1-0.2)2 = 1.28. The Brier score is proper, which means it incentivizes truthful reporting. Finally, for questions with ordered outcome bins (e.g., “0.2 inches or less of rain”, “more than 0.2 inches but less than 0.5 inches of rain”, and “0.5 inches or more of rain”), there is a comparable ordered Brier score.
Chris Karvetski is Senior Data and Decision Scientist with Good Judgment Inc.